Active containers and statistics
Active containers and statistics allow you to view data on resource usage.
With this data, the server administrator can:
- select optimal limit values
- identify intruders
- plan scaling
- "compact" clients on the server
- offer additional resources to users in case they lack any
Users can also view their statistics and make informed decisions about upgrading or downgrading their hosting plan.
Active containers
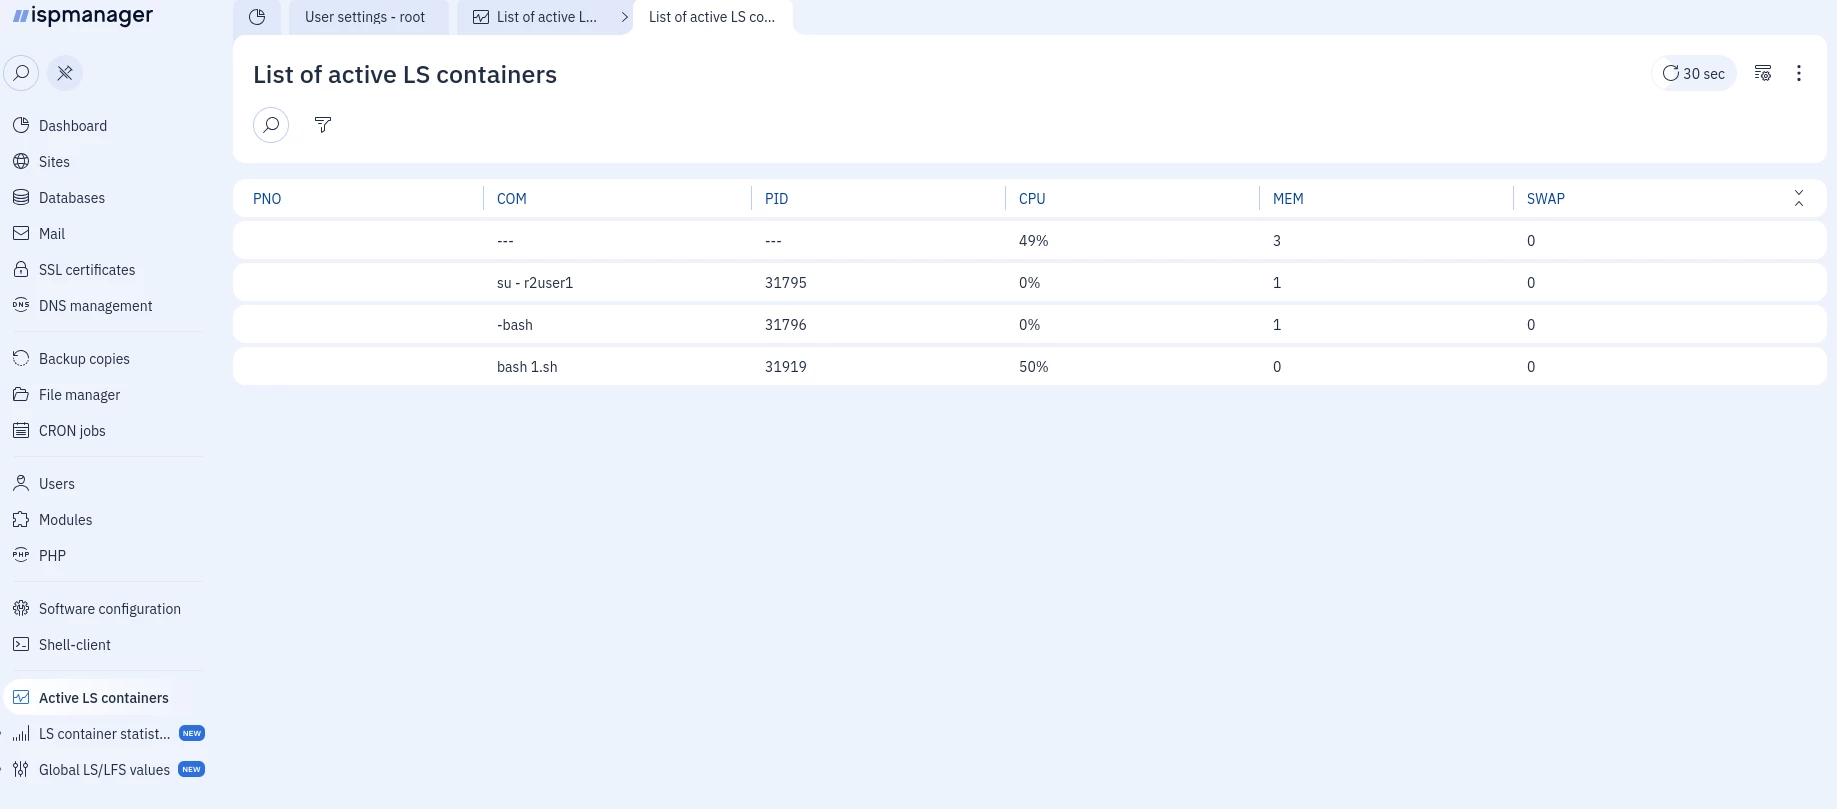
Active containers store data about containers that currently have processes running and allow you to monitor resource usage in real time.
To view active containers:
- Log in to the control panel with an administrator-level account or above.
- Go to the Active LS containers section.
- Select a container.
- On the toolbar, click
 .
.
Statistics
Statistics displays history track of user resource consumption for the selected period. By default, data is stored for 7 days.
To view statistics:
- Log in to the control panel with an administrator-level account or above.
- Go to the LS container statistics section.
- Select a user.
- Select the period you want to generate statistics for.
- Select data averaging parameters:
- Averaging period — data will be averaged over the selected period
- No averaging — average values for every 5 minutes will be shown
- Click Update.
- Go to the User LS container statistics section.
- Select the period you want to generate statistics for.
- Select data averaging parameters:
- Averaging period — data will be averaged over the selected period
- No averaging — average values for every 5 minutes will be shown
- Click Update.
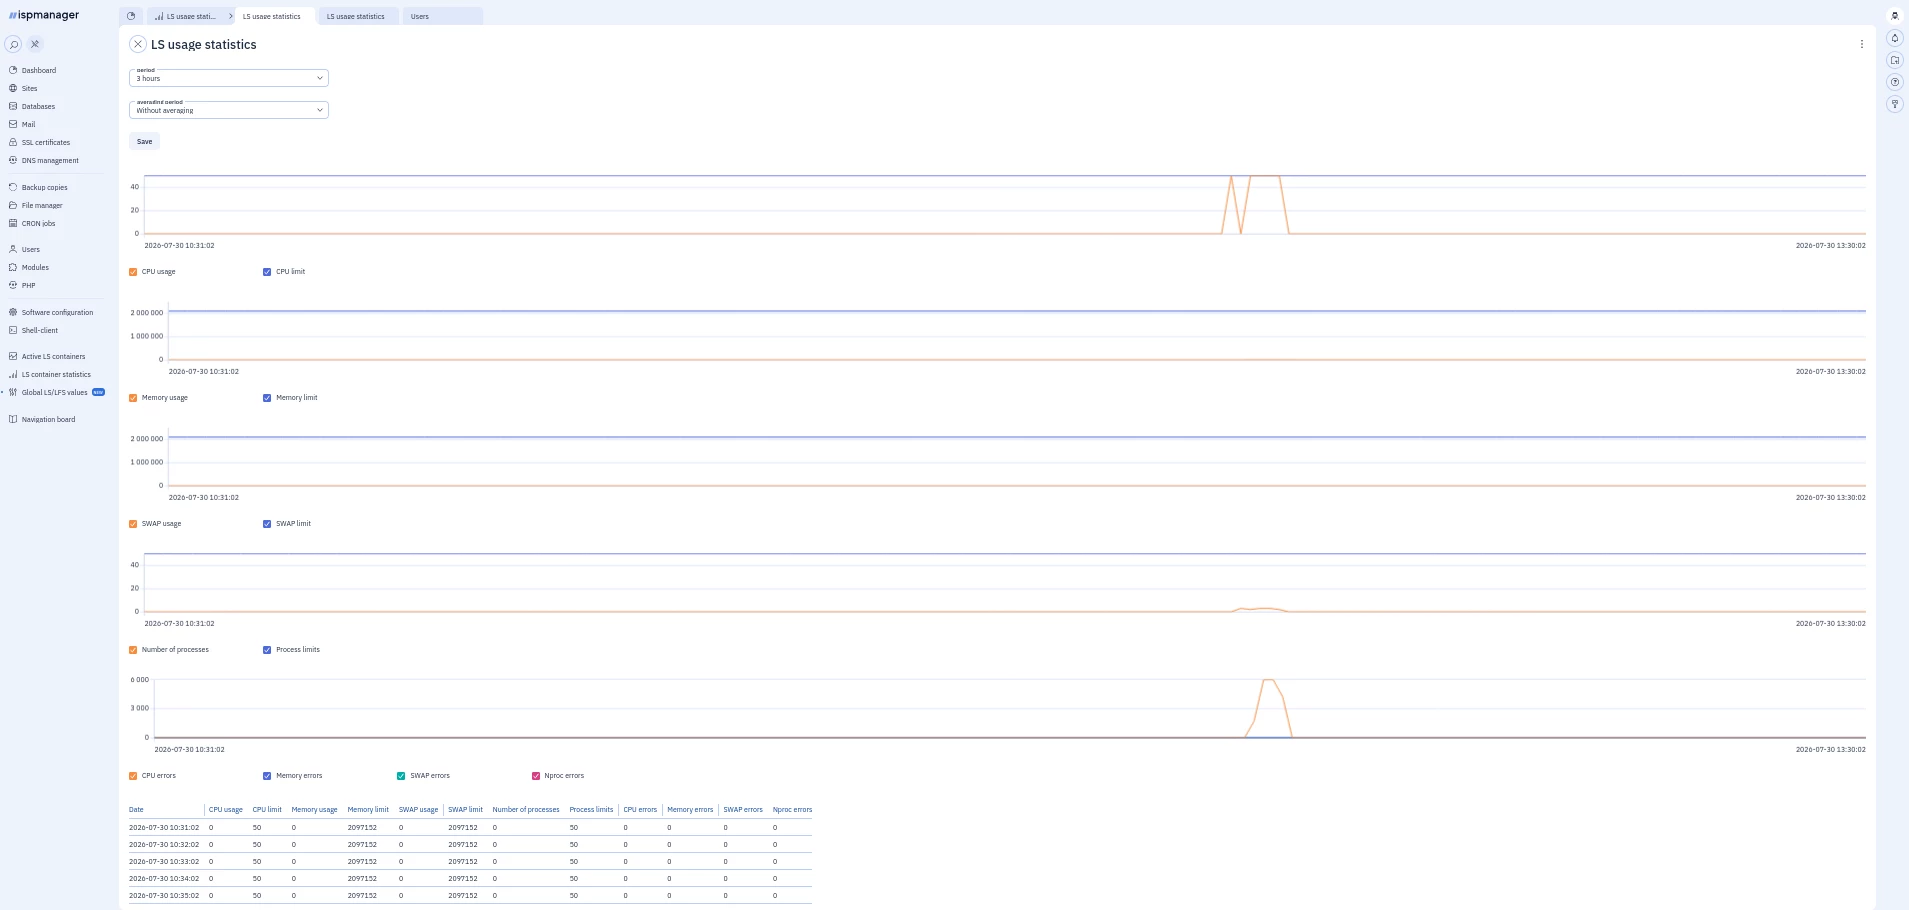
Statistics contain:
- resource graphs: yellow line for usage, blue line for limit
- resource allocation error graph when limit is exceeded
- summary table of all data